1. Material structural and composition analysis services
Chugai Technos collaborates with analysis centers to provide material structural and composition analysis services.
- Analysis of scale, plaque inside pipelines, surface coatings of materials using modern physicochemical methods (XRD, SEM, EDX, XRF, XPS, FT-IR, etc.).
- Deposits in water pipes, chemicals, etc. (whether newly appearing or long-standing);
- Surface coatings of materials;
- Coal dust, fly ash, foreign substances appearing or adhering inside pipelines.
- Analysis covers most elements in the periodic table.
- Transition metals (Chromium, Cobalt, Silver, Platinum…);
- Rare earth metals (Cerium, Lanthanum, …);
- Non-metals (Boron, Silicon, Phosphorus,…).
- Isotopes and hybrid states, existence forms (α, β, γ, …).
- Checking the thickness of metal plating layers.
Advantages of modern analysis methods:
- Require a minimal amount of sample (0.1g is sufficient), suitable for analyzing foreign substances appearing during production or product preservation processes;
- Various types of samples: solid or liquid;
- Both metallic and its compounds can be analyzed (inorganic, organic, metal complexes,…).
Applications:
- Planning and implementing measures to handle and prevent incidents occurring with equipment;
- Providing assessments of product purity and material composition.
2. Methods and Equipment Used
2.1. X-Ray Diffraction (XRD)
(XRD) is the phenomenon of X-rays scattering on the crystal surfaces of solids due to the periodic nature of the crystal structure creating diffraction maxima and minima. X-ray diffraction technique is used to analyze the structure of solids, materials,… In terms of physical nature, X-ray diffraction is similar to electron diffraction, the differences in the characteristics of diffraction spectra are due to the different interactions between X-rays and atoms and the interaction between electrons and atoms. It is used to determine the crystal structure of materials, can quickly identify crystalline phases, quantify crystalline phases, and determine particle sizes with high reliability.
Example: Measurement by XRD method on Shimadzu 6100 machine (Japan) with voltage of 40kV, current intensity of 30 mA, scanning angle from 10-80o, scanning step of 2o/minute.
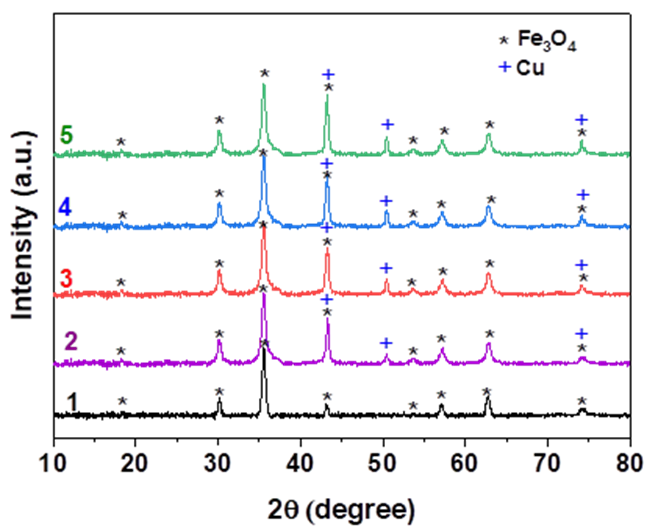 The XRD spectrum results of the material
Performing XRD measurements with the purpose of determining the presence of metals or oxides in the sample. From there, the composition of the sample and its purity level can be identified.
2.2. Scanning Electron Microscope (SEM)
Scanning Electron Microscope (SEM) is a type of electron microscope capable of producing high-resolution images of the surface of solid specimens by using a narrow electron beam scanned across the sample surface. The imaging of the specimen is achieved by detecting and analyzing the emitted radiation resulting from the interaction of the electron beam with the sample surface.
SEM provides images of surface structures, rather than the actual structure of the material. In the microscopic world, surface images are not entirely similar to what we want to see inside. The best resolution of SEM reaches a few nanometers (below 10 nm). SEM is very useful for surface observations that require non-destructive sampling, operating easily without requiring expensive equipment.
Example: Measurement by FE-SEM method on S-4800 machine, Hitachi (Japan) with an acceleration voltage of 10kV, resolution from 200 nm to 1 μm, WD = 7.7 mm.
 SEM measurement results
Performing SEM measurements to evaluate the surface of materials. This measurement is particularly important for plated materials to check the surface plating quality.
2.3. Transmission Electron Microscopy (TEM)
Transmission Electron Microscopy (TEM) is a device for studying the microstructure of solid materials (including biological samples), using a high-energy electron beam transmitted through thin samples and using transmission electron lenses to produce high magnification images (up to millions of times), which can be displayed on fluorescent screens or optical films, or recorded by digital cameras.
Example: Measurement by TEM method on JEM 2100 machine, JEOL (Japan), with main parameters: accelerating voltage: 200 kV, filament: LaB6, resolution between two points: 0.23 nm, two lines: 0.14 nm, scattering capability: selected-area electron diffraction (SAED), convergent-beam electron diffraction (CBED) with wide scattering angles.

TEM measurement results
TEM analysis aims to determine: Check the surface of the sample similar to SEM but at smaller sizes, in nanometers, directing X-rays through to penetrate deeper into the interior size. This method is often used for fields requiring particle size determination such as nano metals, non-metals, electric pins, oils, emulsions.
2.4. Energy-Dispersive X-ray Spectroscopy (EDX/EDS)
Energy-Dispersive X-ray Spectroscopy (EDX/EDS) is a technique for analyzing the chemical composition of solids based on recording the X-ray spectrum emitted from the solid due to its interaction with radiation (mostly high-energy electron beams in electron microscopes).
Example: Measurement by FE-SEM/EDX method on S-4800 machine, Hitachi (Japan) with an acceleration voltage of 10kV, resolution from 200 nm to 1 μm, WD = 7.7 mm.
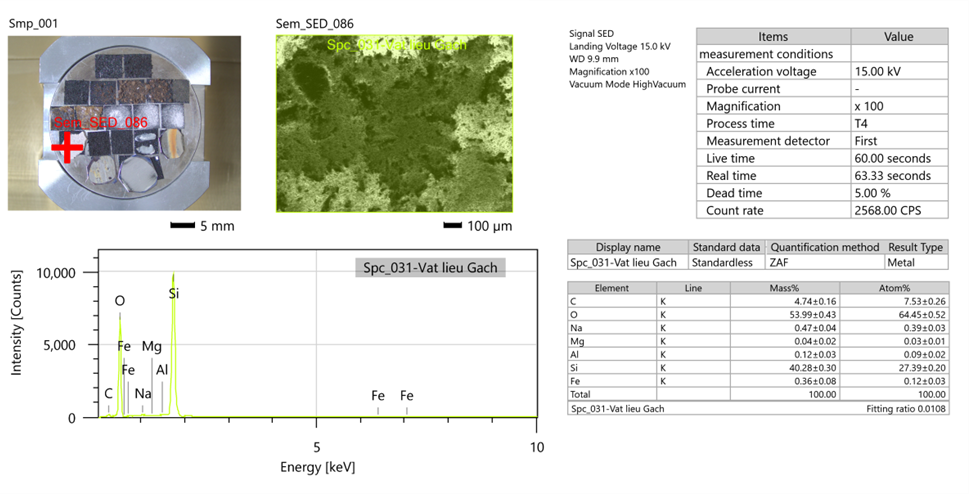 EDX (EDS) measurement results
To obtain an overview of the material, EDX measurements are conducted. The EDX measurement results show a general view of the material state, surface material, and the basic atomic and elemental components present in the sample.
2.5. Fourier Transform Infrared Spectroscopy (FTIR)
Fourier Transform Infrared Spectroscopy (FTIR) is a rapid and fairly accurate method for determining functional groups present in the product. Absorbed molecules will undergo oscillations (displacement of atomic nuclei around equilibrium positions), reducing the bond length of the molecules, and the valence angles will cyclically change. The curve represents the dependence of transmittance on wavelength, the infrared spectrum of the analyzed sample. Each functional group or bond has a characteristic frequency represented by peaks on the infrared spectrum. Thus, based on these characteristic frequencies, the bond between atoms or groups of atoms can be determined, thereby determining the characteristic structure of the analyzed substance.
Example: Measurement by FTIR method on EQUINOX 55 machine, Bruker (Germany).
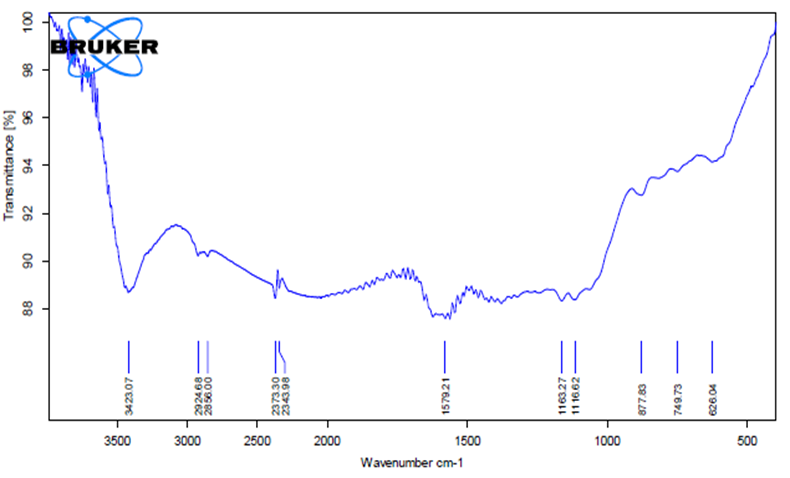 FTIR measurement results
To check whether organic components exist on the surface or inside the material, FTIR measurements are conducted. The FTIR results only show functional groups of organic substances adhering to the material without accurately determining the composition or molecular structure because organic substances have complex structures and have similar functional groups.
2.6. X-ray Fluorescence (XRF)
X-ray Fluorescence (XRF) spectroscopy is an elemental analysis technique applied in quality control and industrial production processes.
The principle of XRF is that when individual atoms are excited by an external energy source, they emit characteristic X-ray photons or wavelengths. By counting the number of photons of each energy emitted from a sample, the elements present in that sample can be identified and quantified specifically and accurately.
Example: Measurement by XRF spectroscopy machine PANalytical Zetium.
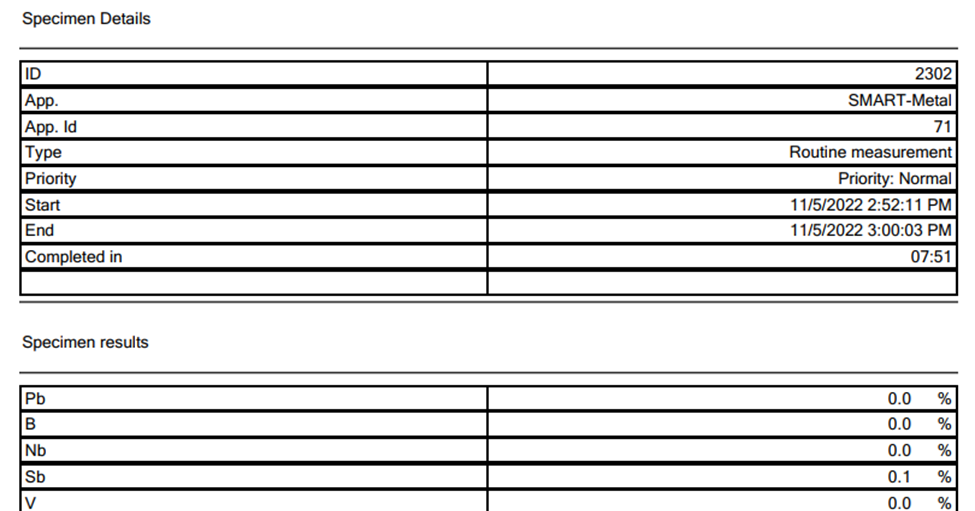 XRF measurement results
To check the composition of metals and oxides in the sample, XRF measurements are conducted. The XRF measurement results show the composition of metals and oxides in the material samples with existing percentage ratios, providing a preliminary assessment of the material to perform appropriate subsequent analyses.
2.7. Thermal Analysis (TG/DTA)
Thermal analysis is a group of analysis techniques in which the physical characteristics of the sample or reaction products are measured as functions of temperature. The sample temperature is controlled according to preset programs. Based on the theoretical basis of thermodynamics, from the changes in these properties, one can determine the required parameters for analysis.
The properties determined include: phase transition temperature, mass loss, heat of transition, size changes, stress, viscosity, elasticity. There are several different thermal analysis methods, such as:
Thermal Gravimetric Analysis (TGA); Differential Thermal Analysis (DTA). Thermal Gravimetric Analysis is an analysis method in which the change in the sample’s mass under the influence of temperature is recorded according to a program recorded as a function of temperature or time. The thermal gravimetric analysis technique is based on continuously recording the mass change of the sample during heating or cooling, and is useful for quantitatively analyzing physical or chemical changes with mass changes. For example, chemical changes due to dehydration, decomposition, oxidation, reduction, melting, vaporization, adsorption, and desorption.
Differential Thermal Analysis (DTA) is a technique in which the temperature difference between the measured sample and the standard sample (comparison sample) is detected to determine the thermal changes occurring inside the sample during heating or cooling. The temperature difference between the measured sample and the standard sample is detected by thermocouples placed on the metal base plate of the sample holder.
Example: Measurement by TG-DTA method on TGS/DSC 3+ machine, Mettler Toledo (Switzerland), measuring from room temperature to 800°C, atmospheric pressure, heating rate 10°C/minute for samples.
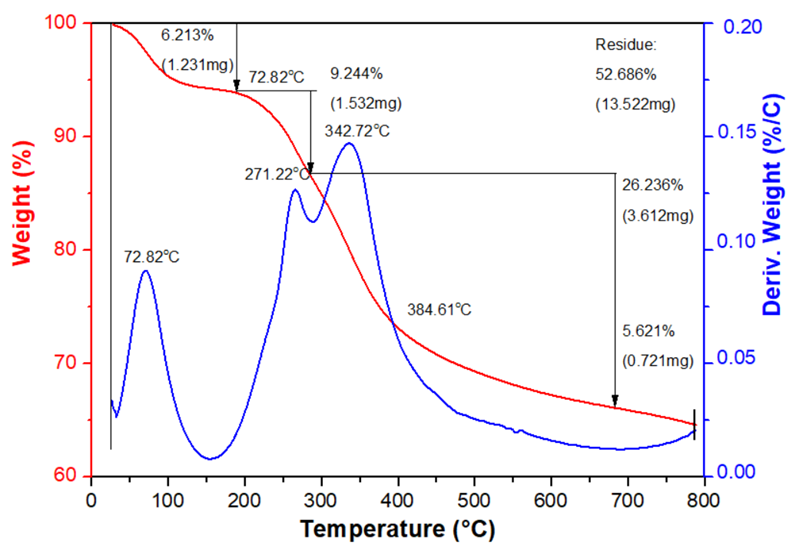 TG-DTA measurement results
TGA analysis aims to determine: Mass loss during phase transition. The mass loss over time and temperature due to dehydration or degradation. It is commonly used for compounds containing organic components and water in samples.
2.8. Vibrating Sample Magnetometer (VSM)
Vibrating Sample Magnetometer (VSM) is a device for measuring the magnetic properties of materials, operating on the principle of detecting electromagnetic induction signals when vibrating the sample in a magnetic field. The sample under test is mounted on a non-magnetic vibrating rod and placed in a region of uniform magnetic field created by the poles of an electromagnet. Since the sample is ferromagnetic, it is magnetized in the magnetic field and produces a magnetic field. When the sample is vibrated at a certain frequency, the magnetic flux generated by the sample passing through the coil induces a varying electromotive force, which is proportionally related to the magnetic moment M of the sample.
Example: Conducted on LakeShore 7404 VSM machine located in the Micro-Nano Technology Laboratory, University of Technology – Hanoi National University.
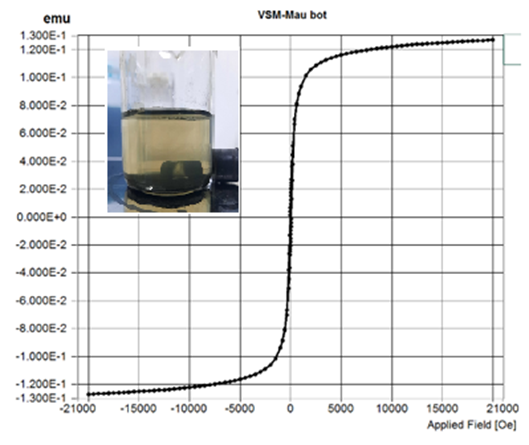 VSM measurement results
VSM analysis aims to determine: The magnetic properties of the sample, often observed in iron and its oxides. If the sample exhibits magnetic properties, it indicates the presence of iron and its oxides in the sample. Additionally, it can also evaluate the corrosion of materials such as pipes and tanks during use.
2.9. X-ray Photoelectron Spectroscopy (XPS)
X-ray Photoelectron Spectroscopy (XPS) is a sensitive surface quantitative spectroscopic technique based on the photoelectric effect that can determine the elements present inside the material (elemental composition) or covering its surface, as well as their chemical states and the overall electronic structure and density of electronic states in the material. XPS is a powerful measurement technique because it not only displays which elements are present but also shows other elements they are bonded to. This technique can be used to shape the straight line of the elemental component on the surface or in depth when combined with ion beam sputtering methods.
XPS is often applied to study chemical processes in materials in the received state or after separation, scraping, contact with heat, gas or reacting solution, ultraviolet radiation, or in the ion implantation process.
XPS is commonly used to analyze inorganic compounds, metal alloys, polymers, elements, catalysts, glass, ceramics, paints, paper, ink, wood, plant parts, cosmetics, teeth, bones, medical implants, biological materials, coatings, lubricants, adhesives, ion exchange materials, and many other types.
Measured by the XPS machine AXIS Supra, Shimadzu (Japan).
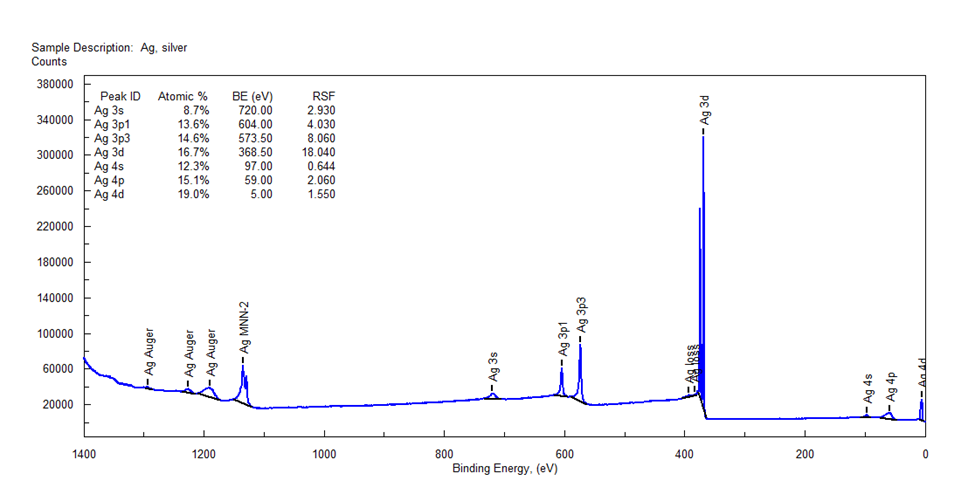 XPS measurement results
Using XPS method to accurately determine the metal and oxide components present in the sample. In addition, it is also applied to check the thickness of the electroplating layer at the nanometer scale.
2.10. Nuclear Magnetic Resonance (NMR)
NMR spectroscopy is based on the recording of the resonance process generated by nuclear spin particles with spin not equal to 0 excited by the energy of the RF radio frequency wave under the influence of the external magnetic field Bo. This process will create differences in the spin states of the nuclei and their corresponding energy levels.
Nuclear Magnetic Resonance (NMR) is a spectroscopic technique for observing local magnetic fields around atomic nuclei. This spectroscopic technique is based on the interaction between matter and electromagnetic radiation. The test sample is placed in a magnetic field, and the NMR signal is generated by exciting the nuclei with electromagnetic waves into nuclear magnetic resonance, which is detected by an extremely sensitive probe. The surrounding magnetic field of the nuclei in the molecule changes the resonance frequency, allowing detailed study of the electronic structure of the molecule and individual functional groups of the molecule.
Because the fields are unique or highly characteristic for different compounds, in modern organic chemical research, NMR spectroscopy is one of the most useful methods for determining organic compounds. The most common nuclei used in NMR analysis are proton 1H NMR and carbon-13 13C NMR spectra and can be applied to any type of sample containing nuclei with spin.
Example: Measured by the NMR spectrometer AVANCE III HD 500 MHz, Bruker Biospin (Switzerland).
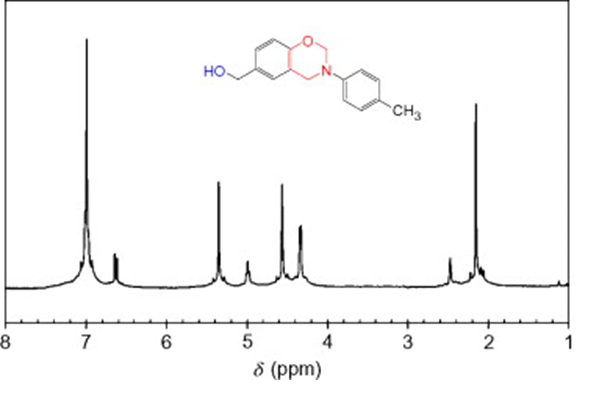 NMR measurement results
NMR analysis aims to determine: The positions of functional groups, bonds present in organic compounds. This method is often used to identify newly synthesized compounds, compounds whose exact formulas have not been determined, such as organic synthesis, pharmaceuticals, and natural compound research.
2.11. Brunauer–Emmett–Teller (BET) Surface Area Measurement
The surface area of materials is often determined by BET analysis of nitrogen gas adsorption isotherms at -196°C, but sometimes other adsorption gases can be used. The pore size ranging from meso to microporous (diameter range of 0-500 Å) is determined by BJH or DA analysis of nitrogen gas adsorption isotherms at -196°C or carbon dioxide adsorption isotherms at -10°C to enhance resolution in the micropore range.
Measured by BET method on Quantachrome Instrument Quadrasorb SI model (USA). The total pore volume is calculated at a relative pressure P/Po of 0.95.
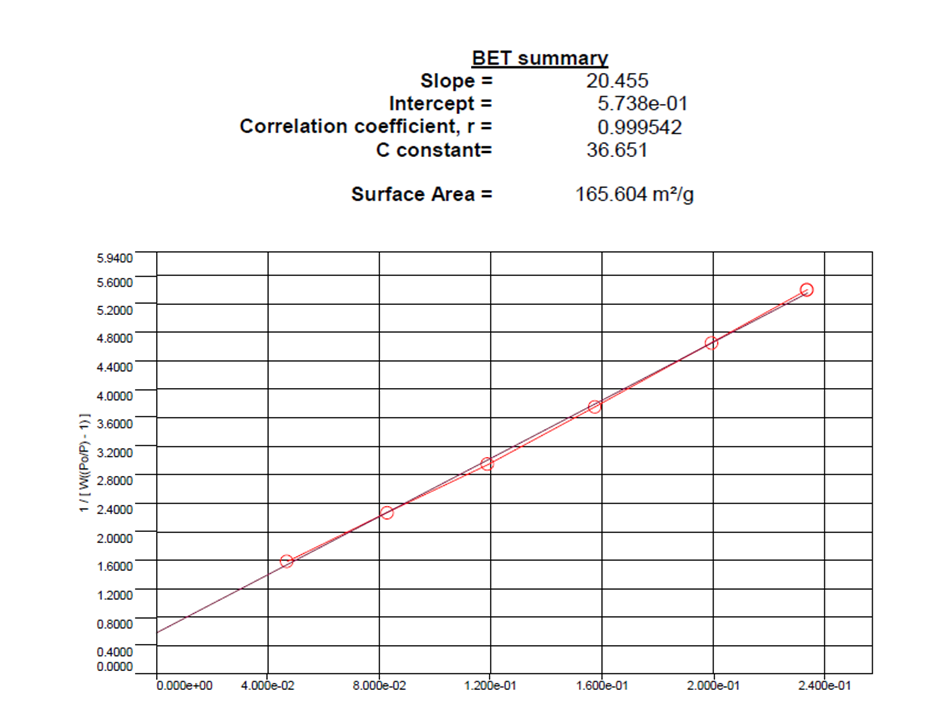 BET measurement results
BET analysis aims to determine: The specific surface area of the sample through the BET equation. It is applied in material adsorption and absorption, to check catalysts after a period of use (both solid catalysts used in gas or liquid phase), helping to quickly check the activity centers remaining after a period of use, for treatment measures.
If you have any need for structural and compositional analysis of materials, please call the Hotline: 0909-714-566 or leave your information HERE for Chugai Technos to quickly contact you for inquiries and support.